Let’s face it. Bitcoin has gone from boom to bust in the last year. The latest severe crush to Bitcoin and cryptocurrencies as a whole was the implosion and fraud behind FTX. It seems that a 30-year old CEO who was a massive political donor and who was incredibly sloppy with a squirrel’s nest on his head was going to be the master of Washington’s regulatory framework going forward. And now the crypto community must further deal with the issues that crypto has not lived up to the financial freedom and hedge against any adverse economic issues at all.
How much investor capital has been lost is not going to be know, but it’s in the billions of dollars. And then after the sudden resignation of CEO Sam Bankman-Fried, communication from management and the company went dark other than a massive hack whereby a few hundred million worth of crypto has suddenly gone missing.
We can debate the FTX scandal all day, but there is really one question that matters for those of us who had zero direct exposure to FTX and the people running it — Has Bitcoin, and its top ETF, finally bottomed?
First off, calling a bottom day in and day out is a sucker’s game where very few people win out over time. Trading should be about catching trends and riding them while they last. Investing is picking a point you are comfortable with to build a position you can hold for a long time. So this is not going to be a report calling “Bitcoin has bottomed! Buy!” nor is it going to be “More pain is coming now! Sell!” Unfortunately, the charts are not looking very favorable at all.
The largest “Bitcoin ETF” is the ProShares Bitcoin Strategy ETF (NYSEArca: BITO). The fund launched in October-2021 right as Bitcoin itself was peaking. What you call the top on Bitcoin will depend on which system you use for evaluating the prices, but let’s just ballpark Bitcoin’s zenith at almost $70,000 as a nice wholesome number — versus approximately $16,500 today.
The “Bitcoin ETF” has a 52-week range of $9.60 to $41.86. ProShares still has a June 30, 2022 date on its Fact Sheet and its net assets were listed as $601.61 million. The assets held are likely less than that now. That same Fact Sheet shows that a $10,000 investment at inception would have led to an account value of $2,903.00 for a loss of approximately 71%.
As this ETF invests in Bitcoin futures contracts and T-bills rather than Bitcoin itself, what do the tea leaves look like today. The website StockCharts.com offers some very insightful trading views using candlestick charting and moving averages. It is quite customizable and they offer many other great views as well. This is their image below.
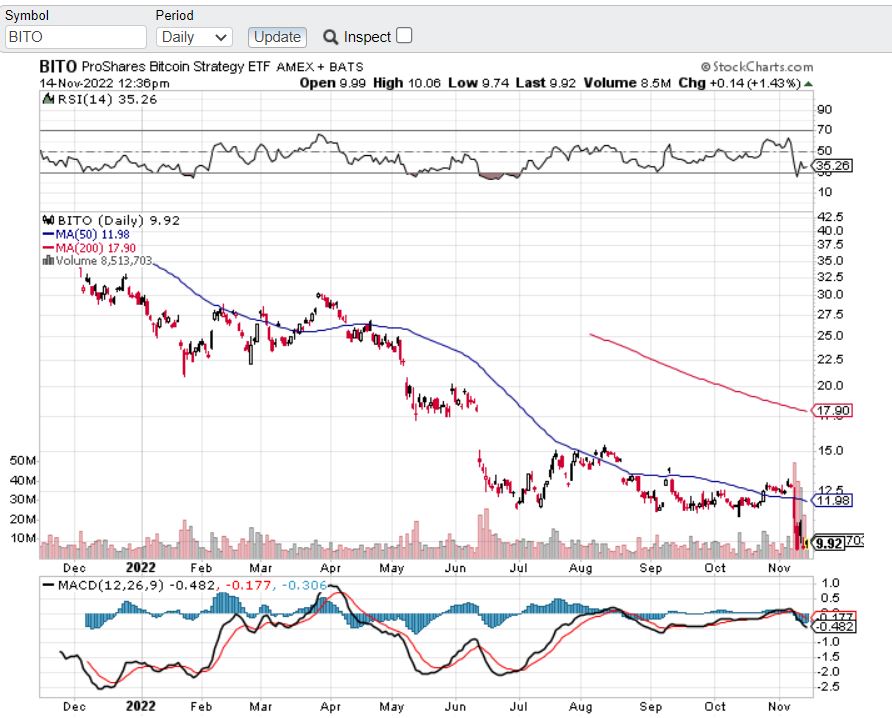
With BITO trading at $9.91 as of the chart’s time snapshot the 50-day moving average is still up at $11.98. Unfortunately, the 200-day moving average is much higher at $17.90. And because the fund is barely a year old, the 200-day moving average has only been visible and trackable since August.
A look at the current chart shows that Bitcoin’s downtrend and every successive rally have not been able to move handily above that 50-day moving average (and again it’s $2.00 and change under it now). This chart does not exactly predict the future, but it is absolutely a representation of what the current investor and trader sentiment looks like.
The long and short of the matter is that sentiment for Bitcoin and cryptocurrency is currently at a dire situation. That might be enticing to many contrarian investors looking to pick up cheap assets, but the FTX scandal is one which seems to keep having a ripple effect. The term “counterparty risk” is even back in vogue for nearly the first time since the on-set of the 2008 Global Financial Crisis.
Most of the active cryptocurrency crowd on social media has gone dark or is in the process of wanting its pound of flesh. The hallmarks of a Madoff crime scene after the FTX scandal have been suggested by more than just a few crypto-philes and crypto-skeptics alike. The lawsuits are going to be endless here, but the remedies are not all that straightforward as of today.
It seems painful to think of Bitcoin and the Bitcoin ETF dragging further, but this chart is one that is likely to face massive overhang as sellers who held Bitcoin and other crypto assets elsewhere are able to get out at levels they entered or where there had been prior support lines.
This is one of those situations where we are all going to get to find out the conclusion at once. Until there some stabilization, this chart of the Bitcoin ETF still looks rough.
Categories: Digital& NFT