Whether you have been buying stocks, long-term bonds or Bitcoin, the bull market and great recovery came to a screeching halt in 2022. The good news is that the market drop didn’t occur as fast nor as severely as during the 2020 plunge as the world went from boom to absolutely economic lock-down under COVID-19 restrictions. The bad news in 2022 is loaded up on high inflation, war in Ukraine, the Fed’s tightening cycle, Fed’s balance sheet reduction, newly emerging job cuts, lower corporate earnings, and lack of new fresh ideas. This all adds up to a scenario where the persistent pessimism is likely to continue for some time. The backdrop for a “recovery catalyst” just feels elusive. This has a very bad and obvious negative backdrop for traditional investors, and this remains to be seen whether or not it will ripple as deeply in the collectibles markets and alternative assets that have not broken down.
The real question that investors and collectors alike need to to ask is easy but comes without easy answers — how long do bear markets typically last?
The second question, which actually identifies the formal pain portion of the equation — just how bad do these bear markets typically get before they bottom?
Getting the investing community and the public to agree to when these bear markets should be tracked and how they should be categorized isn’t universal. Some indexes and sectors refuse to participate equally when you accept that the stock market is actually a market of stocks. Many companies and sectors operate completely independently and may have little to do with the broad market. At this time in 2022, oil and gas stocks have rallied massively and defense stocks are considerably higher than at the start of 2022. Despite severe boredom, gold has managed to hold its own in the wake of the market turmoil.
On last look, the S&P 500’s low on June 16, 2022 was down 23.3% from its peak. That formally lands the market in the bear market (-20% from peak) territory. The Dow Jones Industrial Average was down “only 18.9% as of that same period from its peak, but the tech-heavy NASDAQ was last seen down a whopping 33.8% from its peak. Exactly half of the S&P 500 was down 20% and 122 of the 500 members were down 30% or worse year-to-date.
Another issue to consider is that the alternative asset class of high-end collectibles isn’t always tied to the broader market malaise. Rather than seeing an outright collapse as some collectors (and alt-investors) feared in 2020 under the COVID-19 panic, collectibles prices of anything that was easy to transport either held their own or they surged higher. But what about the great Bitcoin & Crypto Crash that has been seen in 2022? This has been unprecedented in the absolute dollars that have been lost since the crypto-peak in November 2021.
As for high-end collectibles, the market has remained more than resilient so far in 2022. Modern art, vintage sports collectibles, collector cars, wine and whisky, key comic books of the Silver Age and Golden Age, and other categories within collectibles have continued to see record-breaking prices after record-breaking prices. This has been seen in releases and reports from Heritage Auctions, Goldin.co, PWCC Marketplace and many other venues. So what do collectors and those of us who invest directly into collectibles as an alternative asset class have to expect when the stock market is in a bear market and the debate about the next recession rages on? It would be foolish to assume prices of high-end collectibles can only rise endlessly even if there is a degree of price protection that has been the norm.
The bear market of 2020 under COVID-19 was sudden and vicious. The S&P 500 lost about 34% of its value after peaking in February 2020 and by the trough in March. A HartfordFunds table showed that the 2020 bear market was the shortest bear market on record at just 33 days! The instant effort to save the public and to come up with plans for saving paychecks paid off, and the bull market was able to recover rapidly. Stock market prices soared, a sudden drop in real estate activity exploded higher, and high-end collectibles surged in value as we were all stuck at home and looking to relive certain memories.
The Global Financial Crisis of 2008 and 2009 was a long process that came with massive pain and resulted in the world’s top governments saving the banks and major financial players to avoid a systemic collapse of the global economies. Some have argued that saving the banks meant that the public was hung out to dry, but looking at what could have been under a “laissez-faire” (let the chips fall where they will fall) would have been far more disastrous than the pain that was felt. And heading into the COVID-19 pandemic, banks and corporations had some of the strongest balance sheets ever — so helping he public to avoid mass eviction and mass unemployment under lock-down and work-from-home measures was also a no-brainer.
Hartdford’s table (citing Ned Davis Research) for the bear market of the “GFC” was broken out as two bear markets. One from October 9, 2007 to November 20, 2008 — with a duration of 208 days and a S&P 500 drop of about 52%. This was complicated as it was followed by another systemic drop, with a drop of more than 27% from January 6, 2009 to March 9, 2009 — a mere 62 day bear market. After that, the major economy central banks had bailed out the banks and adopted zero-rate and what ultimately led to negative interest rate policies.
The prior bear market cycle in 2000 was the implosion of the Dot-Com Bubble. From March 24, 2000 to September 21, 2001 the 546 day bear market came with S&P 500 losses of more than 36% over that duration. That of course included the sudden and unexpected pain of the 9/11 terrorist attacks and the immediate layoffs announced in the following days. But a double-dip followed and from January 4, 2002 to October 9, 2002 the S&P 500 drop in that 278 day period was 33.7%. If you overlay those times, the peak to trough 2 and 1/2 years with a total S&P 500 drop of just over 50%. And many of the great tech stocks of that era never recovered or took a full decade to recapture their old highs.
These were the top index performances year-to-date and versus their 52-week highs as of the morning of June 15, 2022, before the FOMC’s 75 basis point rate hike on Fed Funds:
- S&P 500 at -21.3% YTD and -22.1% from its highs!
- DJIA -16.2% YTD and -17.7% from its highs!
- NASDAQ-100 at -30.6% YTD and -32.5% from its highs!
And this is the sector-by-sector performance year-to-date measured by the top ETFs:
- Financials (XLF) -19.9% YTD!
- Utilities (XLU) -7.3%!
- Materials (XLB) -14% YTD!
- Industrials (XLI) -16.9% YTD!
- Tech Stocks (XLK) -27.5% YTD!
- Healthcare (XLV) -14.45% YTD!
- Defense & Aerospace (ITA) -6.6% YTD!
- Dividends & Buybacks (DIVB) -15.7% YTD!
- S&P 500 Dividend Aristocrats -14.1% YTD!
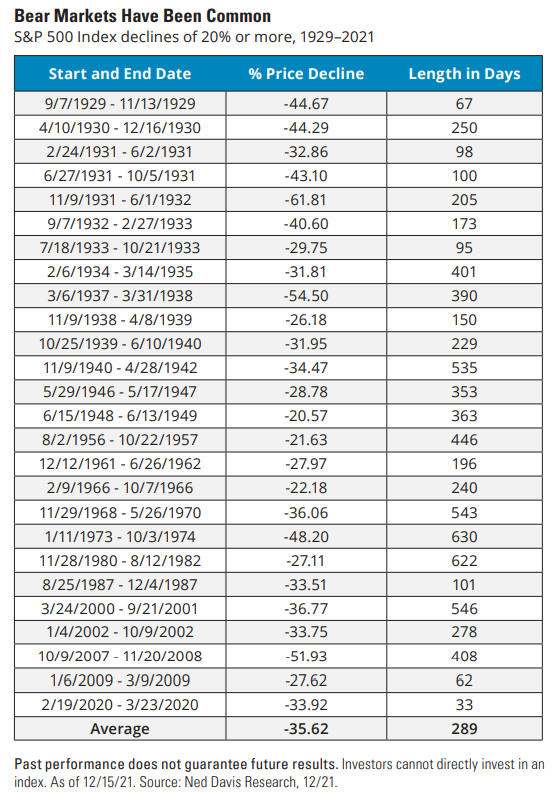
The Hartford Funds also points out multiple characteristics of typical bear markets. The first is the -20% formality, and the second is that bear markets typically see a loss of 36% in the S&P 500 from peak to trough. That tracks a total of 26 bear markets since 1928. The average length of a bear market is also shown to be 289 days (9.6 months) — versus 991 days (2.7 years) for a typical bull market run from trough to the next peak. The other issue is that they count on average a duration of every 3.6 years as the long-term frequency between bear markets.
Some market pundits will also remind you that the saying “time in the markets will always overcome timing the markets.” HartfordFunds pointed out that half of the S&P 500’s strongest single-day gains over the last 20 years took place during those bear markets. Another observation was that 34% of the S&P 500’s best single-day gains took place during the first 2 months of a the rekindled bull markets — and it is quick to point out that this is even before it is clear that the next bull market had even begun.
There is still an ongoing debate over whether the United States is entering a recession or not. Collectors Dashboard would point out that all recessions are different, and using inflation-adjusted Gross Domestic Product (GDP) and inflation-adjusted consumer spending habits would point to a technical recession already likely present. That said, the 3.6% current unemployment (May-2022 data) and relatively strong consumer spending and savings should act to lessen the blunt force trauma of this assumed recession barring any additional jolts beyond Russia/Ukraine, China (persistent zero-Covid lockdowns), Taiwan, inflation and shortages, and more.
There are many things that have to play out as 2022 enters its second half. These are just some of the macroeconomic backdrops that need to occur before “chicken bulls” are likely to feel the worst is over in the stock market:
- The Ukraine invasion by Russia may come to a negotiated standstill (or it may continue, TBD).
- Jerome Powell suggested that the imbalances in unemployment have to be normalized (likely higher unemployment).
- The impact of higher interest rates (and expected Fed Funds rate hikes of July and beyond) will take months to filter into the economy.
- The rapid rise in mortgage rates and cratering mortgage demand means that still housing needs to stabilize (that means lower prices).
- The CBOE Volatility Index has been peaking in mid-30s (so far) and remains elevated versus historic levels, but this is still HALF of the panic selling VIX peak in 70s and 80s of March 2020.
- The largest 1-day drop of 3.5% in the Dow Jones Industrial Average during 2022 would not even rank in the top-10 percentage down days in 2020.
- Analysts have still maintained Buy/Outperform ratings on market darlings (MSFT, AAPL, GOOGL, TSLA, AMZN, Etc.) and may not have lowered price targets to realistic upside levels yet (Alphabet GOOGL was maintained as Buy at UBS and the firm cut its price target to $2650 from $3650 on new economic realities, implied upside of ~20% versus prior implied upside of ~66%).
- Employers have only just started hiring freezes and layoffs in last 30-45 days, a trend that generally lasts for months and gets worse before it gets better.
- The fallout from The Great Resignation hasn’t worked into the system fully, and new “quits” may have new sudden reality-checks about their future job prospects.
- Retailers have very mixed demand and inventory matches at present, and it may take multiple quarters to remedy.
A fresh review from Goldman Sachs’ Insights was issued on June 14, 2022 and spells out some additional concerns about the economy and the bear market:
Against a backdrop of sky-high inflation, rising rates, and growing recession concerns, the S&P 500 has had its worst start to the year since 1962, with the tech-heavy Nasdaq and unprofitable Growth companies performing even more dismally. Whether equity markets are in the midst of a paradigm shift and what’s in store for them ahead is Top of Mind. For answers, we speak with ARK’s Cathie Wood, AQR’s Cliff Asness, GSAM’s Darren Cohen, GS GIR’s David Kostin, and GS analysts. The one commonality in their disparate views: good buying opportunities can be found in equity markets today. While Wood still favors innovative Growth companies, Asness beats the drum for Value. But with investors reluctant to re-engage without greater clarity on if equities have troughed, GS strategists find that a likely coming peak in inflation is probably not sufficient to see the bottom, and that similar past drawdowns have only ended when the Fed has shifted towards easier policy. So, for now, they recommend investors reduce portfolio duration and increase exposure to real assets.
The reality is that every bear market and every recession are proving to be quite different. This is happening real-time in 2022, and the drop in Bitcoin from November-2021 has been 71% from peak to trough so far — hence “the bitcoin crash” that is referenced daily. The double-digit (mostly) inflation rate has not been seen since the 1980s and 1970s and we are coming off of a time where virtually zero-rate policies driving the public into risk assets is now being reversed. The realization that the bottom tick in a bear market will not be known for some time if you read into the lessons that have been laid out. At least you know where you stand as of now in the 2022 bear market.
Categories: Cars & Auto, Coins & Money, Comic Books, Digital& NFT, Fine Art, Misc., Sports, Watches & Jewelry, Wine & Whiskey